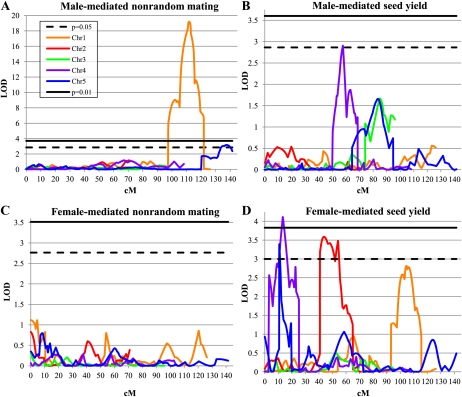
Figure 2.
QTL map of loci for nonrandom mating and seed yield traits. The dashed black line and solid black line indicate the LOD scores for P = 0.05 and 0.01 thresholds, respectively. Orange, red, green, purple, and blue lines indicate the LOD scores for chromosomes 1, 2, 3, 4, and 5, respectively. A, Profile for male-mediated nonrandom mating phenotype. B, Profile for male-mediated seed yield. C, Profile for female-mediated nonrandom mating phenotype. D, Profile for female-mediated seed yield.

