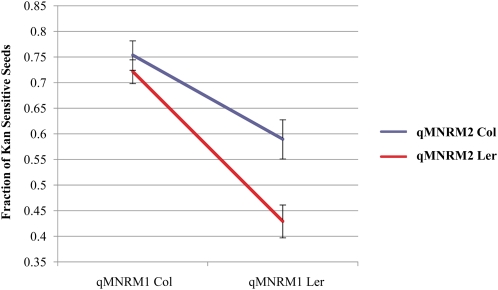
Figure 3.
Epistasis effect between qMNRM1 and qMNRM2. Graph shows the average pollen siring success (and se), as denoted by the percentage of progeny that are kanamycin sensitive, when the Col or Ler allele is at qMNRM1 and qMNRM2. When qMNRM1 is Col, qMNRM2 has very little effect on pollen siring success. When qMNRM1 is Ler, however, the Col allele of qMNRM2 increases the siring success of the pollen grain.

