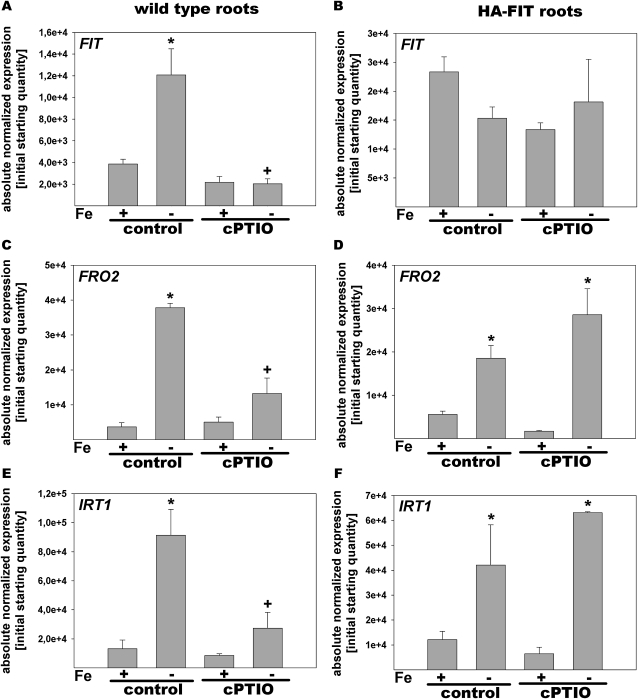
Figure 5.
Altered gene expression in response to cPTIO. Reverse transcription-quantitative PCR analysis is shown in wild-type (A, C, and E) and HA-FIT (B, D, and F) roots treated with or without cPTIO. Plants were grown in the 6-d agar growth system with FIT (A and B), FRO2 (C and D), and IRT1 (E and F). * Significant change versus +Fe of each treatment (P < 0.05); + significant change versus the control at each Fe supply (P < 0.05). n = 2.

