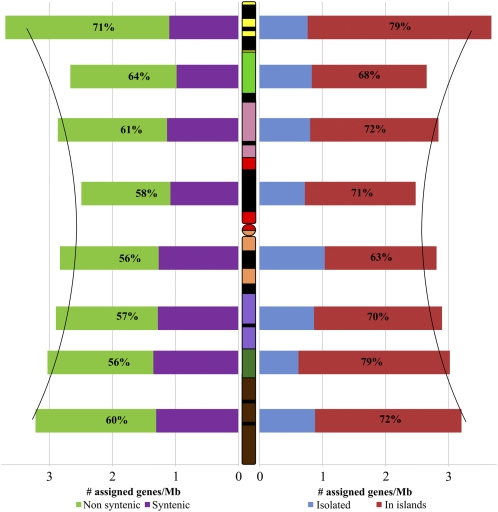
Figure 1.
Gene distribution along the wheat chromosome 3B. Each color on wheat chromosome 3B corresponds to a deletion bin. Yellow, 3BS8-0.78-1.00; light green, 3BS9-0.57-0.78; pink, 3BS1-0.33-0.57; red, C-3BS1-0.33; orange, C-3BL2-0.22; purple, 3BL2-0.22-0.50; dark green, 3BL10-0.50-0.63; and brown: 3BL7-0.63-1.00. The black segments correspond to heterochromatic regions identified by C-banding, the colored segments to the euchromatic regions, and the circle to centromere. On the left, the density of syntenic genes is represented by purple bars. The density of nonsyntenic genes is represented by green bars. The proportions of nonsyntenic genes per deletion bins are shown as percentages within the green bars. On the right, the density of isolated genes is represented by blue bars. The density of genes organized in island is represented by red bars. The proportions of genes organized in island per deletion bin are shown as percentages within the red bars. The two black curves represent the regression curve of gene density.

