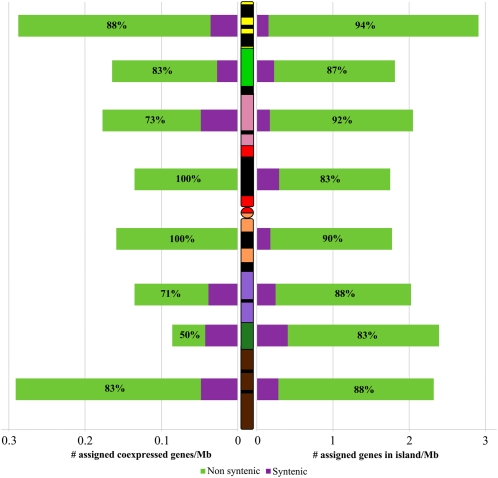
Figure 3.
Proportion of syntenic and nonsyntenic gene islands and coexpression clusters along the wheat chromosome 3B. The purple bars represent the density of genes part of an island or a coexpression cluster composed by syntenic genes only. The green bars represent the density of genes part of an island or a coexpression cluster in which at least one nonsyntenic gene is present. On the left, the density of genes part of a coexpression cluster is shown. The proportions of genes part of coexpression cluster in which at least one nonsyntenic gene is present are shown as percentages within the green bars. On the right, the density of genes in island is shown. The proportions of genes in island in which at least one nonsyntenic gene is present are shown as percentages within the green bars.

