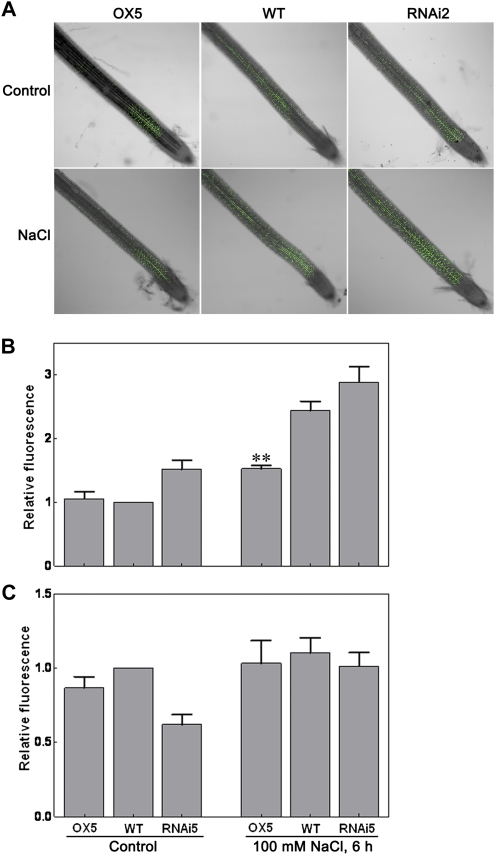
Figure 10.
Apoplastic and cytosolic ROS in situ localization under normal conditions or salt stress treatment. A and B, The accumulation of ROS in apoplast of wild-type (WT), OsTRXh1 overexpression (OX), and RNAi plants. Seedlings were exposed to 100 mm NaCl and then stained with OxyBURST Green H2HFF BSA for 30 min. A, Fluorescence images. B, Fluorescence intensity. The data represent means ± se of measurements taken from at least 15 roots for each experiment. C, Cytosolic ROS detection under normal conditions or salt stress treatment. The seedlings were exposed to 100 mm NaCl and then stained with OxyBURST Green H2DCFDA for 20 min. The data represent means ± se of measurements taken from at least 15 roots for each experiment. Bar with asterisks indicates P < 0.05; two asterisks indicate P < 0.01.

