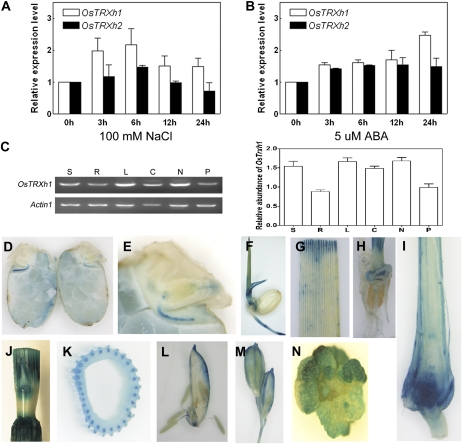
Figure 5.
Expression pattern of OsTRXh1. A and B, Real-time Q-PCR analysis of OsTRXh1 and OsTRXh2 expression under salt stress and ABA treatment. Total RNA was extracted from 10-d-old seedlings treated with 100 mm NaCl (A) or 6-d-old seedlings treated with 5 μm ABA (B) for 0, 3, 6, 12, and 24 h. The data represent means ± se of three independent experiments. C, OsTRXh1 expression pattern and densitometric analysis in various organs: seedlings (S), roots (R), leaves (L), columns (C), nodes (N), and panicles (P). The data are means ± se of three independent experiments. D to N, GUS staining of tissue from the ProOsTRXh1:GUS transgenic lines. D and E, Expression of OsTRXh1 in the germinated seedling. F, Five-day-old seedlings. G and H, Leaf and root of 10-d-old seedlings. I, Longitudinal section of the shoots of 2-week-old seedlings. J, Stem. K, Cross-sections of the stem. L, Palea, stamen, and pistil of a floret. M, Spikelet. N, Callus.

