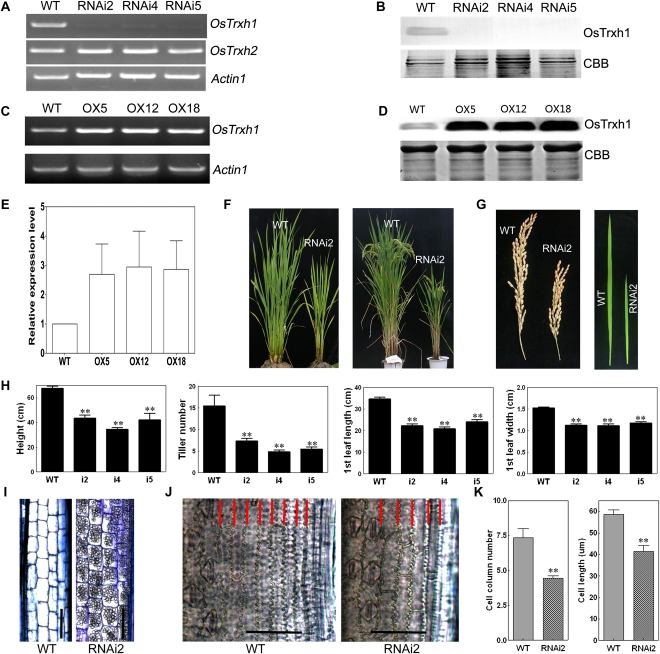
Figure 6.
Molecular identification and phenotypic analysis of overexpression and RNAi plants. A and C, RT-PCR analysis of the expression of OsTRXh1 in wild-type (WT), overexpression (OX), and RNAi plants. ACTIN1 was used as a control. B and D, Western-blot analysis of the expression of OsTRXh1 in overexpression and RNAi plants. The blots of crude protein extracts (20 μg) were probed with antibodies directed against OsTRXh1. CBB, Coomassie Brilliant Blue R-250 staining. E, Densitometric analysis of the OsTRXh1 western blot shown in D. The data represent means ± se of three independent experiments. F, Morphology of wild-type and RNAi plants at vegetative and productive stages. G, Main panicle and leaf morphology of control and RNAi plants. H, Statistics of plant height, tiller number, leaf length, and leaf width of wild-type and RNAi plants (n = 20). I, Microscopic observation of longitudinal sections of the elongated zone of the internode of wild-type and RNAi plants. Bars = 100 μm. J, Micrographs of cleared flag leaves. The cell columns are indicated with red lines. Bars = 50 μm. K, Statistics of cell column number (n = 10) and cell length (n = 20) shown in I. Bars with two asterisks indicate P < 0.01. [See online article for color version of this figure.]

