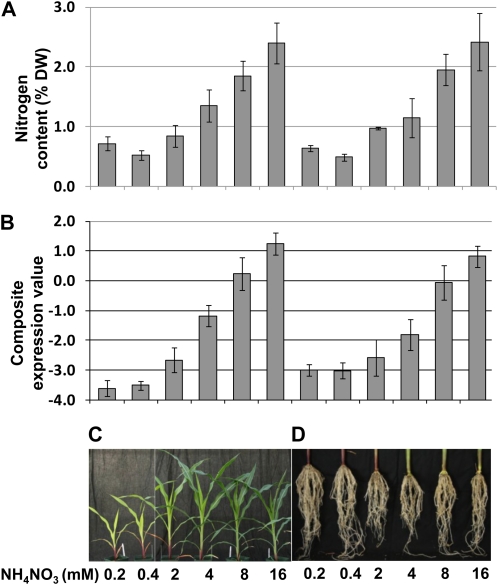
Figure 2.
In planta responses to varying applied nitrogen conditions across multiple tissue types. Plants were grown in soil in a growth chamber to V6 development stage. The youngest mature leaf and total root tissues were collected for analysis. A, Nitrogen content as percentage of dry weight (DW). Note the linear increases in in planta nitrogen content in both leaf and root tissues. B, Biomarker composite expression value from TaqMan PCR assays of eight biomarker genes. Note that the composite scores are in log scale, as described in “Materials and Methods.” C and D, Photographs of representative aerial tissues (C) and roots (D) from plants grown on varying nitrogen levels. Data are derived from three replications. Error bars show ±1 se.

