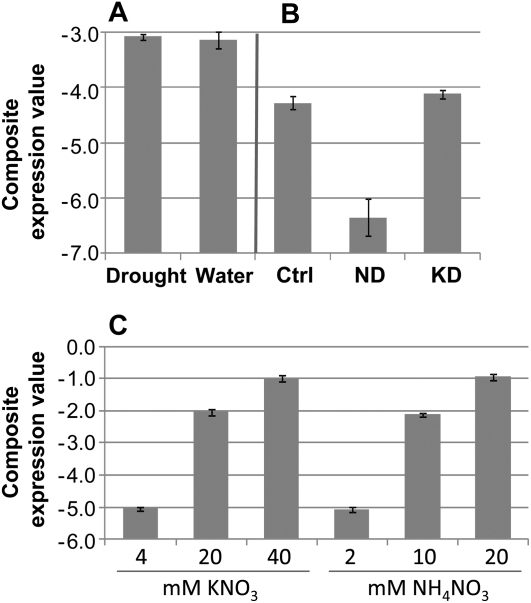
Figure 3.
Biomarkers are specific for nitrogen and are independent of nitrogen source. Biomarker composite expression values are from TaqMan assays of eight biomarker genes. A, Plants were grown aeroponically to V3 leaf stage and then were either maintained (Water) or deprived of water for 4 d until leaf wilting was observed (Drought). B, Aeroponically grown seedlings were grown for 5 d under full nutrient conditions and then either maintained (control [Ctrl]) or deprived of nitrogen (ND) or potassium (KD) for 30 h. Note the similar biomarker composite scores for full nutrient control plants and potassium-deprived plants, whereas nitrogen-deprived plants show a significantly lower biomarker composite score. C, Plants were grown to V6 development stage in the greenhouse with continuous supplementation of either KNO3 or NH4NO3 at three different total nitrogen levels, as indicated on the x axis. Note that the biomarker expression composite scores increase with increasing nitrogen levels in the irrigation solution and show similar responses to total nitrogen with either nitrogen source. Data are derived from three (A and B) or six (C) replications. Error bars show ±1 se.

