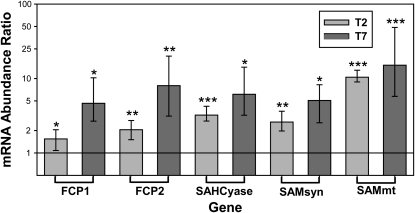
Figure 4.
Relative mRNA abundance ratios at 70 salinity compared to 35 salinity are graphed in the log scale. The horizontal line at 1 demarcates no expression change was observed between treatment groups and values above that line indicates an increase in transcript abundance under high salinity. Transcripts for FCPs (FCP1 and FCP2), as well as the active methyl cycle genes SAHCyase, SAMsyn, and SAMmt increased in hypersaline conditions 2 (T2) and 7 (T7) d following start of 22-h salinity shift. Error bars show ses calculated with REST software. *P < 0.05, **P < 0.01, ***P < 0.0001.

