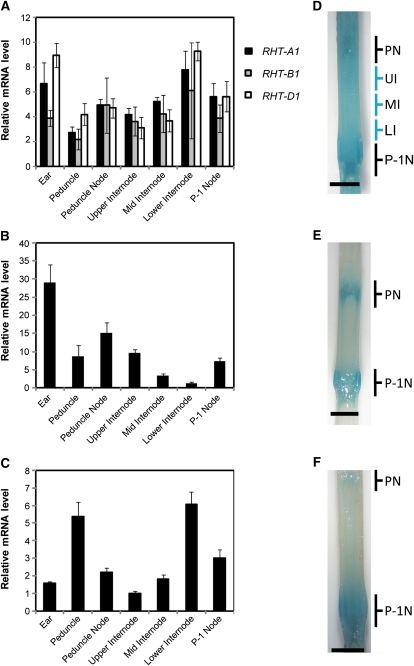
Figure 3.
Expression analysis of the three Rht-1 homeologs and two GA biosynthesis genes in the upper expanding tissues of the developing wheat stem. A to C, Relative expression levels of Rht-A1, Rht-B1, and Rht-D1 (A), TaGA20ox1 (B), and TaGA3ox2 (C) in different regions of the extending wheat stem at 7 weeks post germination. The P-1 internode was divided into three equal sections for tissue collection. The mRNA levels of these genes were determined by qRT-PCR from three biological replicates for each sample type, normalized against UBIQUITIN. Results are plotted as the ratio to the lowest detectable level ± se. D to F, Localization of GUS activity under the control of the Rht-A1 (D), TaGA20ox1 (E), and TaGA3ox2 (F) promoters in an elongating wheat stem at the same stage of development as analyzed by qRT-PCR. The positions of the peduncle node (PN) and the P-1 node (P-1N) are indicated. The positions of the upper (UI), middle (MI), and lower (LI) internodes are indicated in D. Bars = 5 mm.

