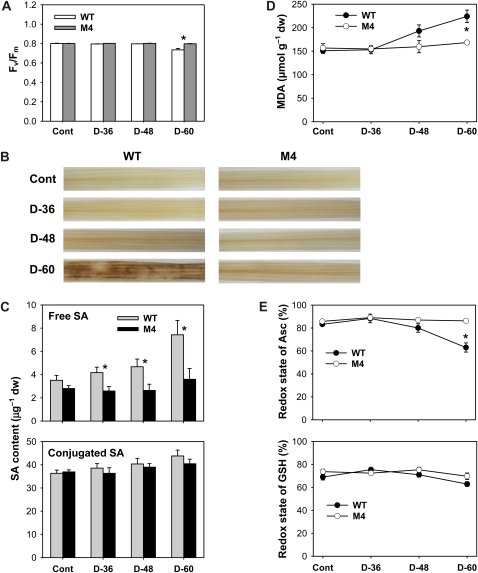
Figure 3.
Oxidative metabolism and cellular redox state in leaves of wild-type (WT) and transgenic plants exposed to drought stress. A, Photosynthetic performance (Fv/Fm). B, H2O2-DAB staining in leaves. Brown spots represent H2O2 localization. C, Free and conjugated SA levels. D, MDA levels. E, Redox state of Asc and GSH, estimated as Asc × 100/Asct, where Asct = DHA + Asc, and GSH × 100/(oxidized GSH + GSH). The plants were subjected to the same treatments as in Figure 2, and treatment notations are the same as in Figure 2. Values are means ± se of six replicates from two independent experiments. * Significant differences between wild-type and transgenic samples as calculated by t test (P < 0.05). dw, Dry weight.

