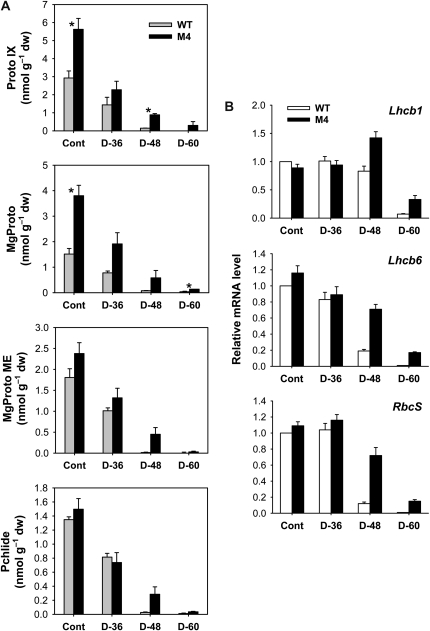
Figure 5.
Distribution of porphyrin metabolites and expression of nucleus-encoded photosynthetic genes in leaves of wild-type (WT) and transgenic plants. A, Proto IX and Mg-branch intermediates. Values are means ± se of six replicates from two independent experiments. *Significant differences between wild-type and transgenic samples as calculated by t test (P < 0.05). B, Expression analysis of nucleus-encoded photosynthetic genes by qRT-PCR. Total RNAs were purified from plants and reverse transcribed. The resultant cDNAs were used as templates for qRT-PCR using Actin as an internal control. The wild-type control was used for normalization, with the expression level of the sample set to 1. Error bars represent se, and representative data from three independent experiments are presented. The plants were subjected to the same treatments as in Figure 2, and treatment notations are the same as in Figure 2. dw, Dry weight.

