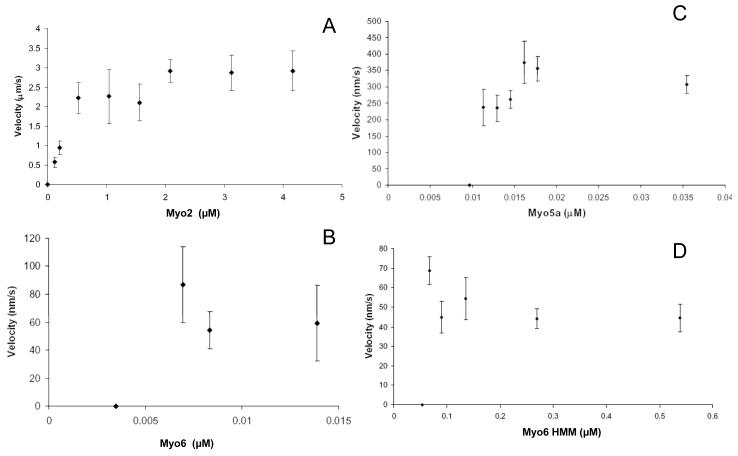
Fig. 2.
Gliding filament velocities of Myo2, Myo5a, Myo6, and Myo6 HMM as a function of motor density. Velocities of rhodamine-labeled actin filaments propelled by directly adsorbed Myo2 purified from mouse cardiac tissue (A), Myo5a purified from chick brain (B), baculo-virus expressed Myo6 (C) and Myo6 HMM (D) in the motility assay are shown. The concentrations of myosin used to coat the surfaces of the motility chambers are shown on the x-axes. Filament velocity averages were obtained from a minimum of 2 days of experiments. Values are represented as mean ± SD. The number of filaments for which velocities were measured ranged from 4-23 (A), 5-17 in (B) and 10-20 in (C) and 7-27 in (D).

