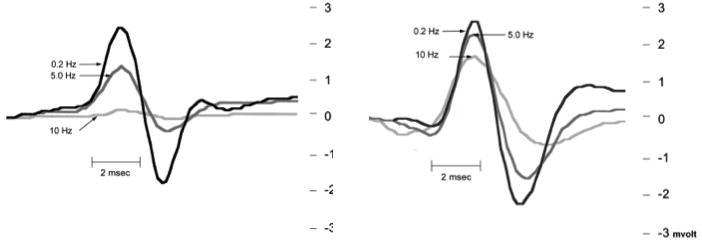
Figure 2.

A. Representative H-reflex recordings of animals tested 7 days after Tx. The H-reflex was observed 8–10 ms after the stimulus. The H-reflex amplitudes at the different frequencies have been superimposed for comparison. The black line represents the H-reflex recorded at 0.2 Hz. The dark gray line represents recording at 5 Hz, and the light gray line represents recording at 10 Hz. Note the decrease in amplitude as frequency of stimulation was increased, indicative of low frequency-dependent depression present at 7 days posttransection. B. Representative H-reflex recording of animals tested 14 days after Tx. The H-reflex responses at the different frequencies have been superimposed for comparison. The black line represents H-reflex recorded at 0.2 Hz. The dark gray line represents recording at 5 Hz, and light gray line represents recording at 10 Hz. Note lack of decrement in amplitude as frequency of stimulation was increased, indicative of a decrease in frequency-dependent depression. The x-axis represents time in msec, the y-axis amplitude in mV.
