FIGURE 1:
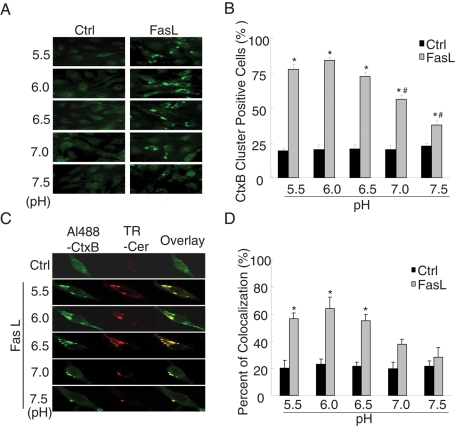
Effects of pH change on the colocalization of CtxB-staining fluorescent patches and ceramide. (A) Representative confocal microscopic images of CAECs stained by Al488-CtxB. (B) Summary of effects showing that FasL significantly increased the percentage of CtxB cluster–positive cells stained by Al488-CtxB at pH 5.5, 6.0, 6.5, 7.0, and 7.5. (C) Representative confocal microscopic images of the colocalization of CtxB-staining patches and ceramide in FasL-treated CAECs at different pH. Al488-CtxB is shown as a pseudo green on the left; Texas red–conjugated anti-ceramide is shown as red in the middle; and overlaid images are shown on the right. Yellow spots in the overlaid images were defined as patches of the colocalization in CtxB-staining patches and ceramide. The images are representatives from six separate batches of CAECs. (D) Percentage changes in positive cells costained by Al488-CtxB and anticeramide antibody during FasL stimulation (n = 6, *p < 0.05 vs. control; #p < 0.05 vs. pH = 6.0 group).

