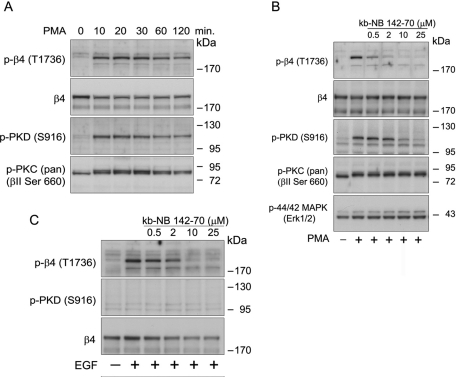
FIGURE 6:
Time course of PMA-induced phosphorylation of β4 at T1736 and inhibition of T1736 phosphorylation by the PKD inhibitor kb-NB 142-70. (A) Time courses of PMA-stimulated phosphorylation of β4 and PKD1 in A431 cells. Growth factor–starved A431 cells were stimulated with PMA for the indicated times. Cell lysates were analyzed by immunoblotting with antibodies specific for phosphorylated β4 (T1736) and PKD1 (S916). (B) Inhibition of PMA-induced β4 phosphorylation at T1736 in A431 cells. A431 cells were pretreated with the indicated concentrations of kb-NB 142-70 for 30 min and then stimulated with 100 ng/ml PMA for 15 min. Cell lysates were analyzed by immunoblotting with antibodies specific for phosphorylated β4 (T1736), PKD (S916), PKC (βII S660), and p44/p42 MAPK. Immunoblotting for total β4 and PKD1 verified that equal amounts of these proteins were evaluated in the A431 lanes. (C) Inhibition of EGF-induced β4 phosphorylation at T1736 in A431 cells. A431 cells were pretreated with the indicated concentrations of kb-NB 142-70 for 30 min and then stimulated with 50 ng/ml EGF for 15 min. Cell lysates were analyzed by immunoblotting with antibodies specific for phosphorylated β4 (T1736), PKD (S916), β4, and PKD1.

