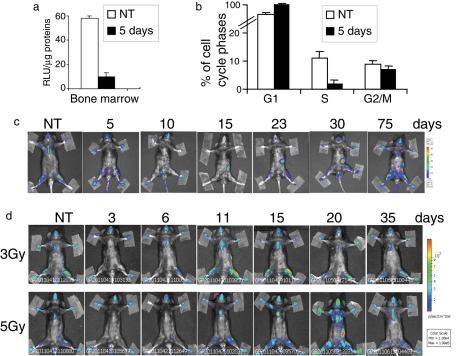
FIGURE 3:
Analysis of luciferase activity upon inhibition of proliferation in MITO-Luc mice. (a) In vitro luciferase activity and (b) FACS analysis of MITO-Luc mouse bone marrow 5 d after treatment with 5-FU antiproliferative drug (150 mg/kg). Error bars represent the deviation of the mean of bone marrow from three animals. (c) BLI of a representative MITO-Luc mouse before (NT) and after (5, 10, 15, 23, 30, and 75 d) treatment with 5-FU (150 mg/kg). The experiments were conducted in five animals. (d) BLI of a representative MITO-Luc mouse before (NT) and after (3, 6, 11, 15, 20, and 35 d) treatment with 3 or 5 Gy. The experiments were conducted in five animals. (c and d) Light emitted from the animal appears in pseudocolor scaling.

