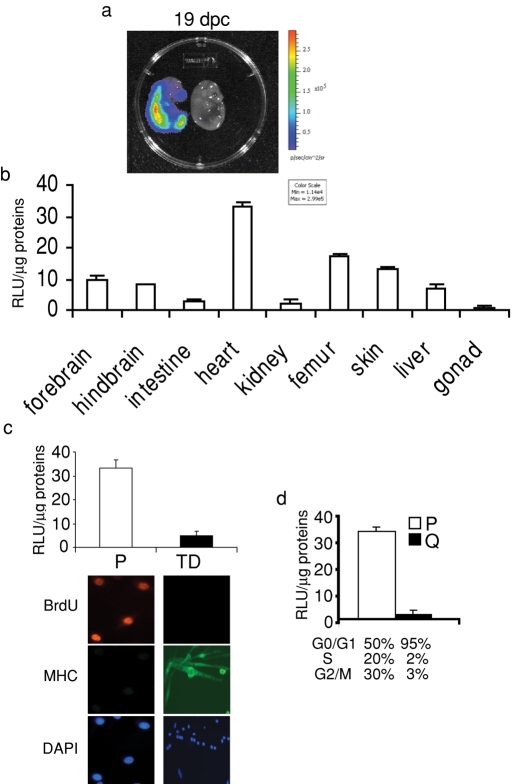
FIGURE 4:
Luciferase activity in MITO-Luc mouse embryos and derived cells. (a) BLI of a representative MITO-Luc embryo at 19 dpc. Both positive and negative littermates are shown. The luciferase activity is visualized in pseudocolor scaling. (b) in vitro luciferase activity in tissues of 19 dpc MITO-Luc embryos. Each bar represents the mean value ± SEM of three to six embryos. (c) In vitro luciferase activity in proliferating myoblasts (P) or terminal differentiated myotubes (TD) derived from newborn MITO-Luc mice. Immunofluorescence to detect MHC or BrdU incorporation is shown. Nuclei were visualized with DAPI. (d) Luciferase activity in proliferating (P) or quiescent (Q) MITO-Luc mouse embryonic fibroblasts. Percentage of cell cycle phase distribution of P and Q cells is reported. Values are the mean of two experiments performed in triplicate.

