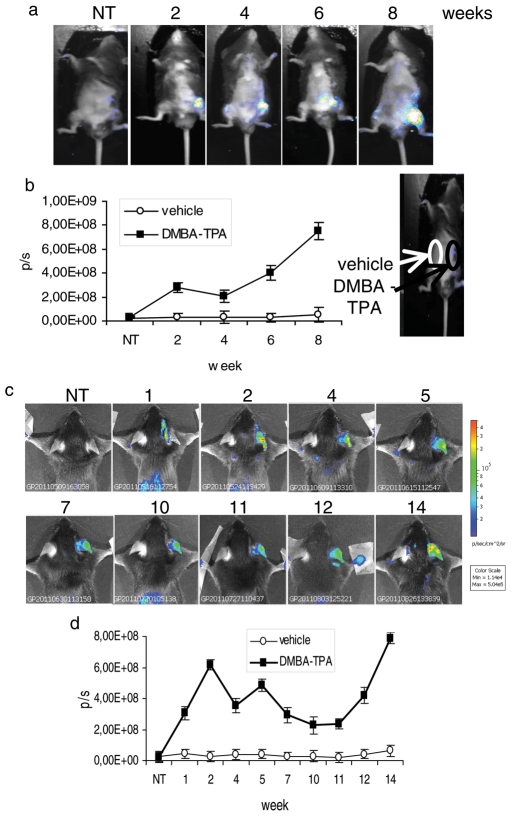
FIGURE 5:
Luciferase activity in MITO-Luc mouse–induced papillomas. (a) BLI of a representative MITO-Luc mouse after 2, 4, 6, and 8 wk of DMBA-TPA treatments on ventral skin. (b) Quantification of emitted light from MITO-Luc mouse skin papillomas. The sites on the ventral surface of the animals in which the vehicle and the DMBA-TPA drugs have been spotted are indicated. (c) BLI of a representative MITO-Luc mouse after 1, 2, 4, 5, 7, 10, 11, 12, and 14 wk of DMBA-TPA treatments on mouse ear. (d) Quantification of emitted light from MITO-Luc mouse ear papillomas. (a and c) Light emitted from the animal appears in pseudocolor scaling. (b and d) Photon emission from the lesions (black square) and from the contralateral part (white circle) measured as photons per second (p/s). Each bar represents the mean value ± SEM of four animals.

