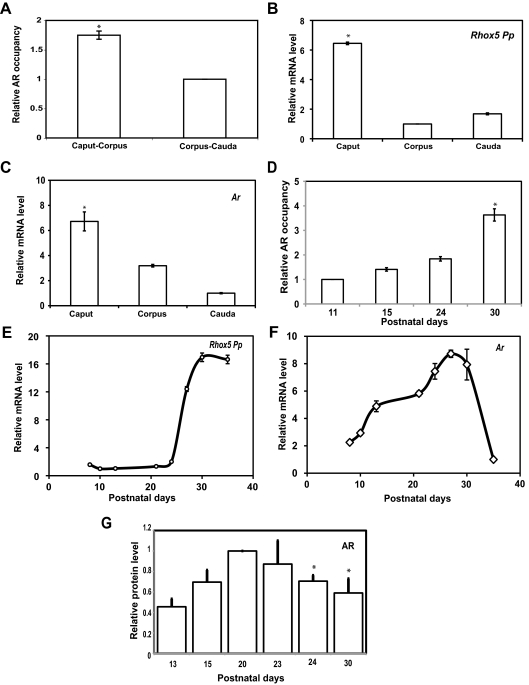
Fig. 3.
Developmental and region-specific pattern of Ar and Pp expression and AR occupancy at the Pp. A and D, ChIP analysis of AR occupancy in adult epididymides segments or postnatal whole epididymides at the indicated time points. The values shown are mean ± se, obtained by real-time PCR from at least three pooled samples run in triplicate from three different experiments. AR occupancy is relative to the corpus-cauda region, which was given a value of 1. B, C, E, and F, Real-time PCR analysis of total cellular RNA from adult epididymides segments or whole postnatal epididymides at the indicated postnatal time points. The values shown are average fold (±se) from at least four independent samples, quantified as described in the Fig. 1E legend (the lowest value in each panel is set to 1). G, Western blot analysis of AR protein level using whole-cell lysates from the epididymides of mice from the indicated postnatal time points. The values shown are average fold (±se) from three individual blots that were each normalized to a loading control (β-actin and β-tubulin). The relative level of AR at d 20 was set to 1; an asterisk indicates statistically significant (P ≤ 0.05) differences from d 20. Supplemental Fig. 7 shows a representative blot.

