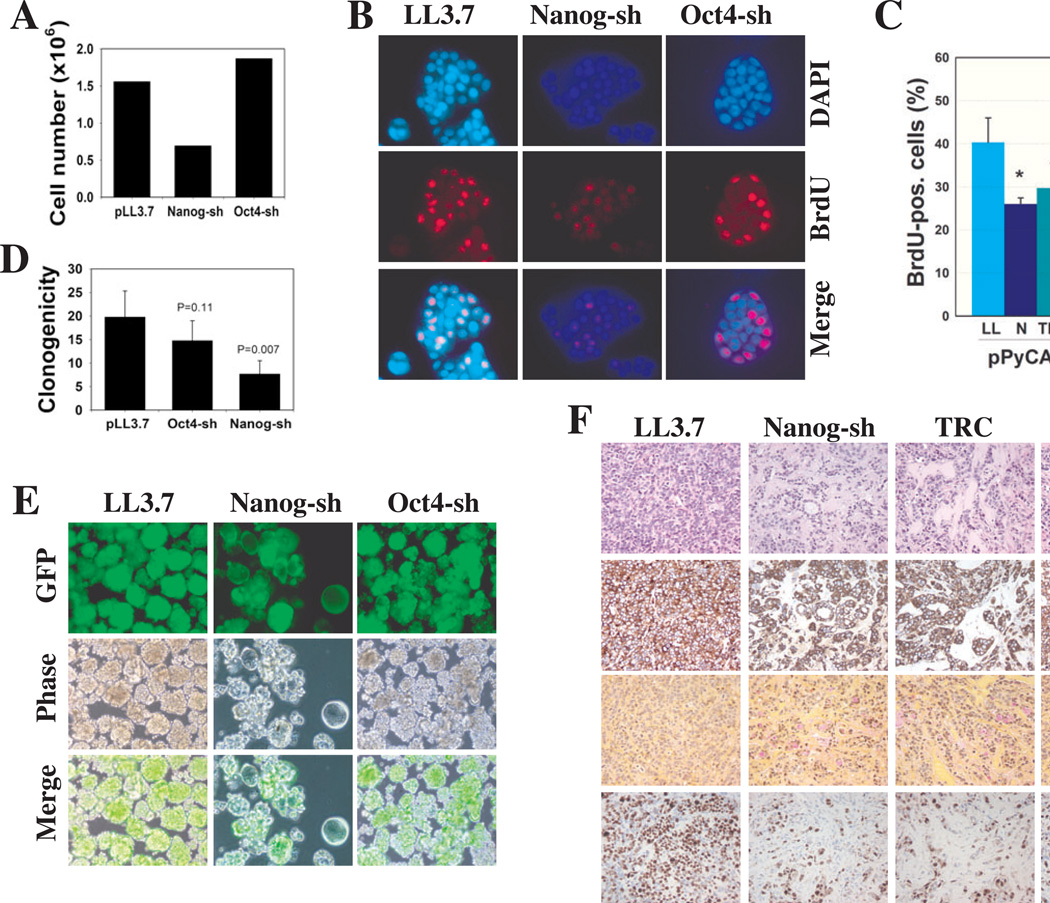
Figure 6. Nanog knockdown inhibits MCF7 cell clonogenic growth, reduces proliferation and alters differentiation.
(A) MCF7 clonal growth. 100 MCF7 cells infected with the indicated vectors were plated (n = 3) in 6-well plates. 21 d post-plating, cells were trypsinized, pooled and counted.
(B) BrdU incorporation assays. MCF7 cells infected with the indicated lentiviruses were cultured overnight on glass coverslips and pulsed with 5 µM BrdU for 4 h. Fixed cells were processed for BrdU immunostaining (red), markedly reduced in Nanog-shRNA transduced cells.
(C) Functional ‘rescue’ experiments. MCF7 cells were infected with the indicated vectors (LL, LL3.7; N, Nanog-shRNA; TRC, TRC-shRNA; MOI 20) and 24 h later, transfected with either pPyCAG or pPyCAG-PN8 (i.e., NANOGP8). 48-h later cells were pulsed with BrdU (4 h) and processed for BrdU staining. A total of 500–1,000 cells were counted by three individuals and the bars represent the mean ± S.D. *P < 0.05 between the two conditions.
(D) 2o MCF7 clonogenic growth. 1,000 MCF7 cells were plated (n = 3) on agarose, and spheres were scored 10 d post-plating.
(E) 2o sphere images. 1o spheres were harvested (10 d after infection) and replated. Shown are representative images one month after replating.
(F) Tumors derived from Nanog-shRNA and TRC-Nanog shRNA-infected MCF7 cells appeared more differentiated (ductal structures and increased mucin) and exhibit lower proliferation (Ki67) than the control tumors. 5-µm serial sections were stained for HE or the molecules indicated on the right (×200).

