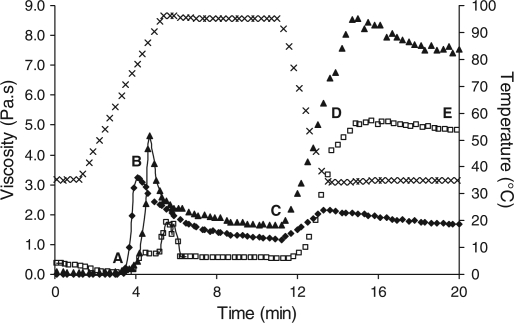
Fig. 1.
Gelatinisation profile of 10% starch (♦), 10% starch + 10% α-casein  , and 10% starch + 10% β-casein (▲); (x) represents temperature profile. Point A on the curve represents the on-set stage of pasting, B represents peak viscosity on heating, C represents viscosity at end of heating, D represents viscosity at end of cooling, and E represents the final viscosity of the paste.

