
Figure 4.
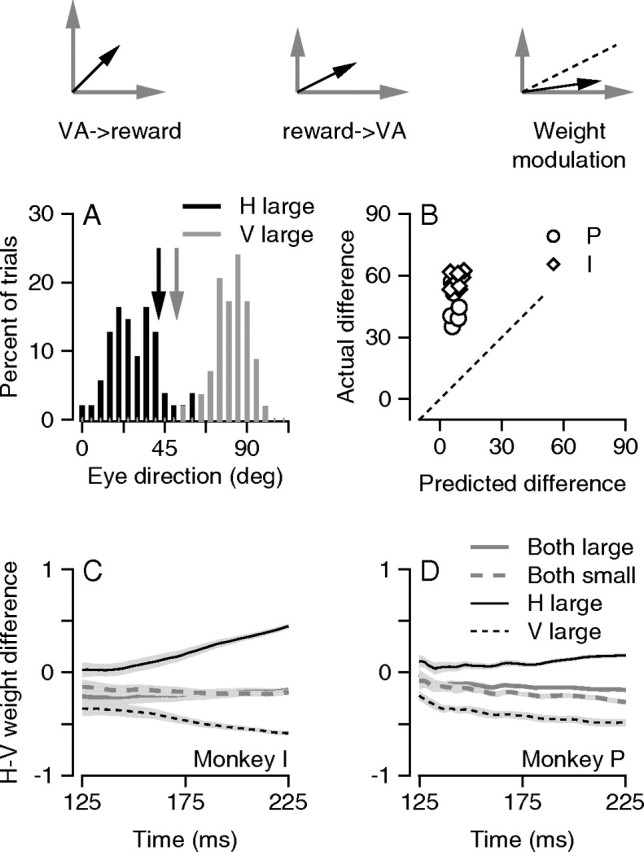
Evaluation of three models for the relative locations of vector averaging (VA) and reward modulation. The schematic diagrams at the top of the figure show the three models. Gray arrows show the responses to each target motion presented singly, modulated by reward size in the second and third models. Black arrows show the eye velocity predicted by each model. The dashed line shows the prediction of equally weighted vector averaging, which differs from the predicted eye velocity only in the third model. A, The distribution of eye direction 200 ms after target onset for 1 experimental day. Black and gray histograms indicate the results when the highly rewarded target moved horizontally (H; at 0°) or vertically (V; at 90°). The vertical arrows indicate the predictions for vector averaging of the appropriately rewarded targets presented singly. B, Comparison of the average direction of the initiation of pursuit in the data with the predictions for vector averaging of the appropriately rewarded targets presented singly. Each symbol shows data from a different experiment (n = 8 and 11 for monkeys P and I). Diamonds and circles represent data for monkeys I and P. The dashed line is the unity line. C, D, The difference between the weighting of the horizontal and vertical targets for two-target stimuli plotted as a function of time from the onset of target motion. Different line styles indicate different reward–size paradigms.