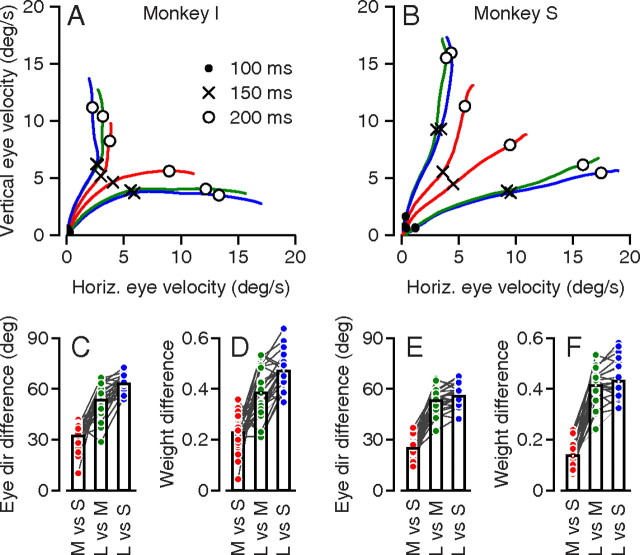
Figure 6.
Graded effects of different reward sizes. A, B, Two-dimensional plots for the two monkeys of average vertical eye velocity versus horizontal (Horiz.) eye velocity for each millisecond in the first 225 ms after the onset of target motion with different reward levels. Traces that travel closer to the horizontal and vertical axis show data for trials with horizontal or vertical highly rewarded directions. For simplicity of presentation, all directions were transformed to plot in the first quadrant. Symbols on the traces indicate different times after the onset of target motion. Blue, green, and red traces represent experiments with reward sizes of large versus small (L vs S), large versus medium (L vs M), and medium versus small (M vs S). C, E, Eye direction 200 ms after the onset of target motion when vertical was the highly rewarded direction minus that when horizontal was the highly rewarded direction. D, F, The weight afforded the highly rewarded direction 200 ms after the onset of target motion minus that afforded the other direction. In C–F, each symbol plots the average from one experimental session. Colors have the same significance as in A and B. Lines connect the three symbols for conditions that were interleaved in the same session. Bars represent the average within each group.

