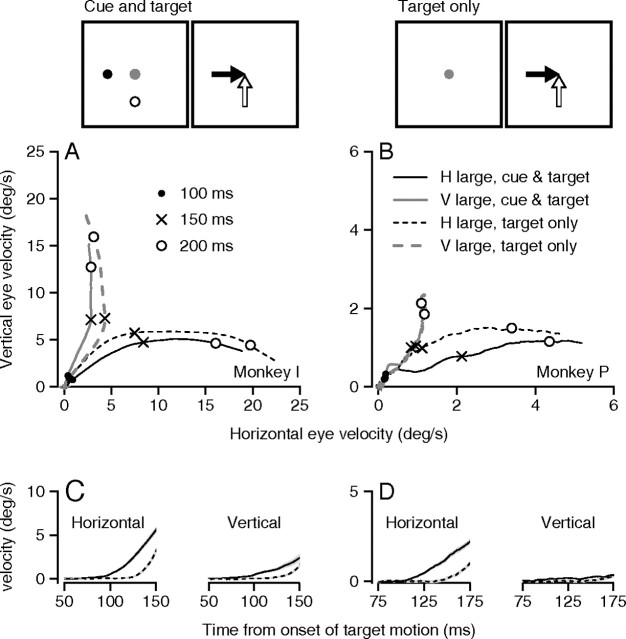
Figure 7.
Latency of modulation of pursuit initiation by reward size. The schematic diagrams at the top of the figure illustrate the structure of the two-target trials. Cue and target, The two tracking targets appeared during fixation, as described in Results, and provided cues for future reward. Target only, The tracking targets appeared and started to move when the fixation spot was extinguished, providing cues for future reward at the same time as motion signals for pursuit initiation. A, B, Two-dimensional plots of average vertical (V) eye velocity versus horizontal (H) eye velocity for each millisecond in the first 225 ms after the onset of target motion in different task configurations. Solid and dashed traces show results for the cue-and-target and target-only conditions. Black and gray traces show data when horizontal or vertical was the highly rewarded direction. For simplicity of presentation, all directions were transformed to plot in the first quadrant. Symbols on the traces indicate different times after the onset of target motion. C, D, For each component of eye velocity, the curves show the difference in each millisecond between the average component of eye velocity when it was in the highly rewarded versus less-rewarded direction. Left and right columns of the figure show data for two monkeys. Monkey P had lower eye speeds partly because we used lower target speeds of 20°/s, instead of 30°/s and partly because it had generally lower eye velocities in the first 100 ms of pursuit than did monkey I.

