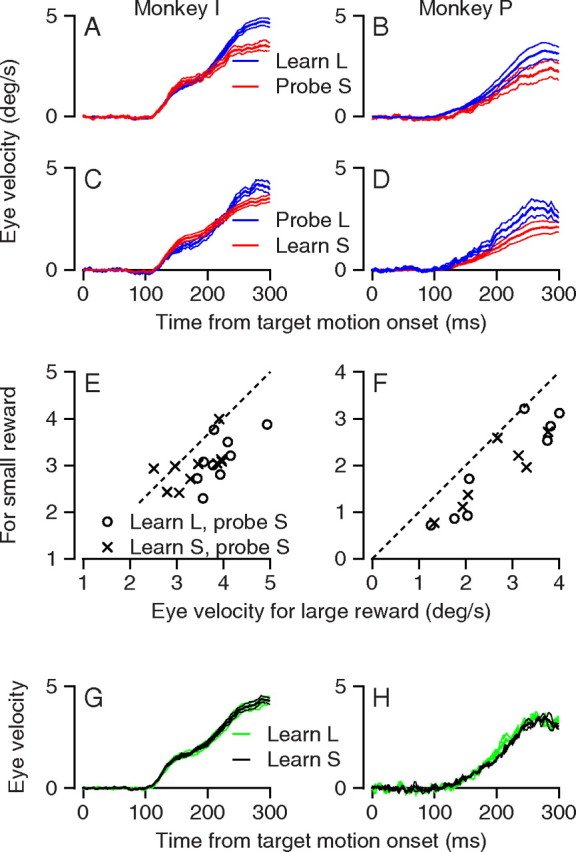
Figure 9.

Effect of reward size on the learned eye velocity in probe trials. A–D, Time course of the average eye velocity in the learning direction for interleaved learning and probe trials. Blue and red traces indicate responses to targets that cued and led to large or small rewards. Ribbons along the traces indicate SEM. In A and B, the learning trials provided large rewards and the probe trials provided small rewards. In C and D, the learning trials provided small rewards and the probe trials provided large rewards. E, F, Quantitative analysis of the effect of reward on the expression of the learning. Each symbol shows the average eye velocity from 200 to 300 ms after target movement during learning and probe trials in one learning block. Data are plotted so that the eye velocity for the targets with small (S) versus large (L) rewards always is on the y-axis versus x-axis. G, H, Time course of the average eye velocity in the learning direction for probe trials with intermediate reward size. Green and black traces indicate responses to probe trials that delivered medium-sized rewards in blocks in which learning trials delivered large or small rewards.
