
Figure 2.
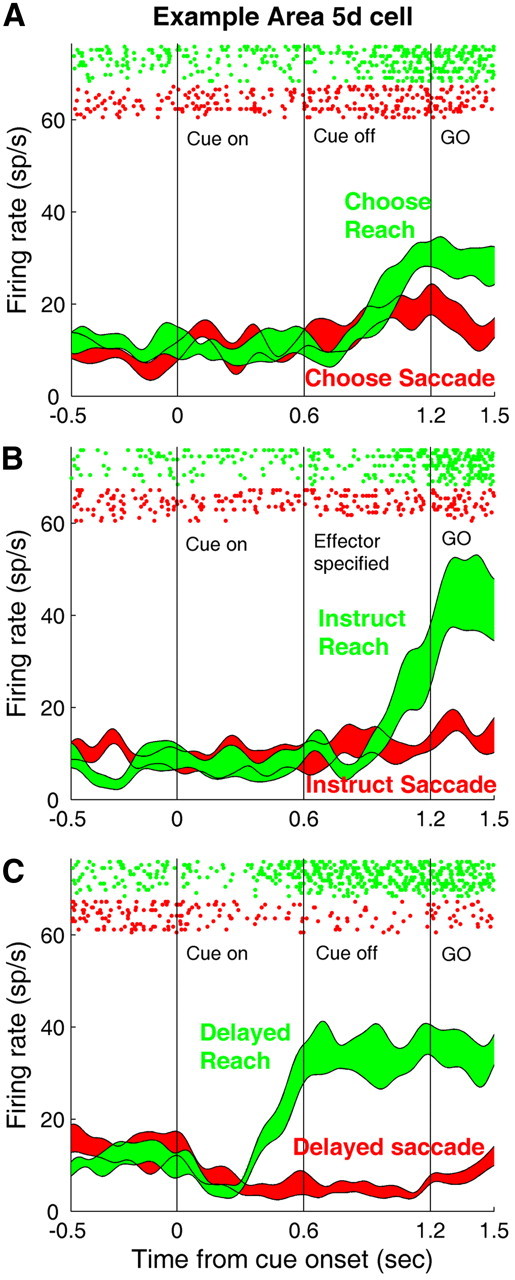
Neural activity of an example cell from area 5d. A–C, Single-neuron activity recorded from area 5d during effector choice, effector instructed, and memory tasks. Spike trains are aligned to the cue onset and each row of rasters indicates every action potential recorded during each trial. Red and green correspond to the trials in which saccades and reaches were performed, respectively. The peristimulus time histograms (PSTHs) were smoothed using a Gaussian kernel (SD = 50 ms), and the thickness of the line represents the SE (±SEM) calculated with the bootstrap method.