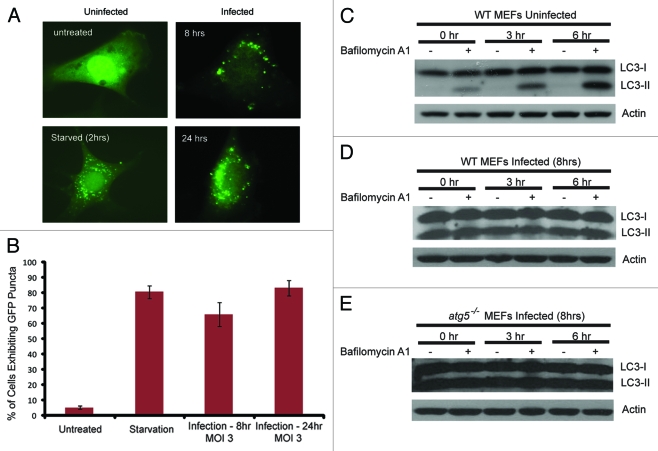
Figure 8.
Analyses of the effect of vaccinia virus infection on GFP-LC3 distribution and autophagy flux. (A) Distribution of GFP-LC3 in uninfected and vaccinia virus infected cells. NIH 3T3 cells that stably express GFP-LC3 were either untreated, or underwent amino acid and serum starvation for 2 h, or infected with vaccinia virus, as indicated. Fluorescent microscopy was performed to visualize the distribution of GFP-LC3. (B) Quantification of (A). (C–E) Immunoblotting assay of wild-type or atg5−/− MEFs either uninfected or infected with vaccinia virus (MOI of 3) for 8 h followed by treatment with 100 nM of bafilomycin A1 for indicated time. Lysates were subjected to SDS-PAGE and separated proteins were immunoblotted using an anti-LC3 and anti-actin antibodies as indicated.

