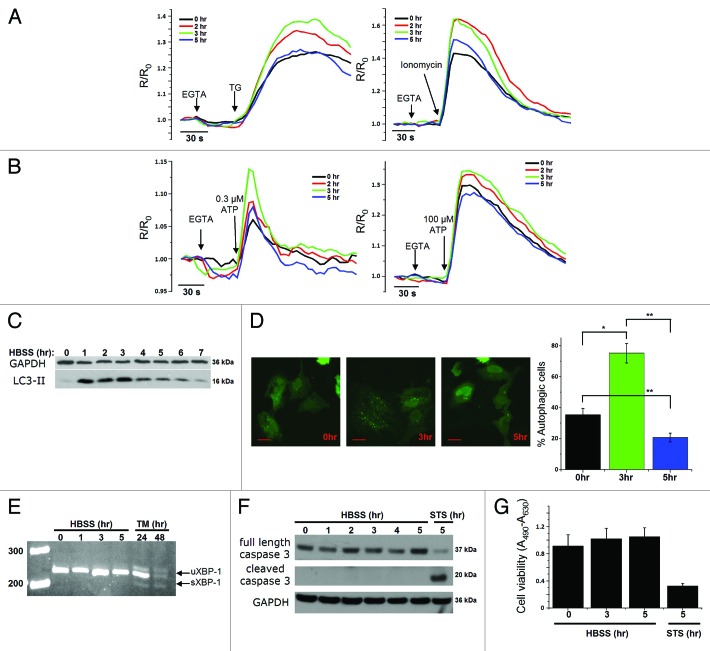
Figure 1.
Transient changes in Ca2+ dynamics after starvation correlate with changes of the LC3-II levels. (A) Measurements of cytosolic Ca2+ signals, displayed as normalized Fura-2 ratio (R/R0), showing the effect of 1 µM thapsigargin (TG) or 10 µM ionomycin in intact HeLa cells with (2, 3, 5 h) or without (0 h) starvation. Representative recordings of the Fura-2 ratio after addition of TG (left panel) or ionomycin (right panel) in cells pretreated with HBSS for 0, 2, 3 or 5 h are shown. Forty-five seconds prior to addition of TG or ionomycin, EGTA (3 mM) was given as indicated. (B) Measurements of cytosolic Ca2+ signals, displayed as normalized Fura-2 ratio (R/R0), after addition of 0.3 µM (left panel) or 100 µM (right panel) ATP in intact HeLa cells with (2, 3, 5 h) or without (0 h) starvation. (C) Representative LC3-II western blots of HeLa cells starved for the indicated time period (0–7 h). (D) GFP-LC3-puncta formation in HeLa cells transfected with GFP-LC3 constructs. Cells were starved (3 h or 5 h) or not (0 h), as indicated. Left: Representative pictures. The scale bar represents 20 µm. Right: Quantification of autophagic cells. Only cells displaying more than 10 puncta were considered autophagic (n = 3). (E) Analysis of XBP-1-mRNA splicing in cells pretreated with HBSS (0–5 h) or 2 µg/ml tunicamycin (TM; 24 h, 48 h); uXBP-1 = unspliced XBP-1; sXBP-1 = spliced XBP-1. (F) Representative caspase 3 western blots of HeLa cells starved for the indicated time (0–5 h) or treated with 1 µM staurosporine (STS) for 5 h. (G) XTT-assay for measurement of cell viability, after incubation in HBSS for the indicated time period or treatment with 1 µM staurosporine for 5 h (n = 4). The cell viability is expressed as the absorbance at 490 nm minus the absorbance at 630 nm (A490-A630). *p < 0.05; **p < 0.01 (paired t-test).

