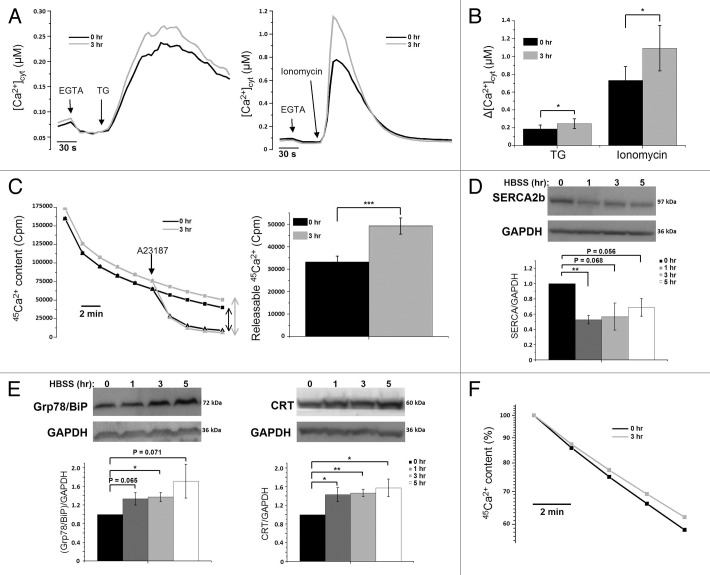
Figure 2.
Increased Ca2+-store content caused by upregulation of Ca2+-binding proteins (CaBP) and decreased ER Ca2+-leak rate during starvation. (A) Fura-2 measurements, calibrated for [Ca2+]cyt in HeLa cells with (3 h) or without (0 h) starvation, after addition of 1 µM TG (left) or 10 µM ionomycin (right). (B) Quantitative analysis of the increase of [Ca2+]cyt (Δ[Ca2+]cyt; assessed by subtracting resting value from peak value) after addition of TG (left) or ionomycin (right) in cells with (3 h) or without (0 h) starvation (n = 7). (C) Unidirectional 45Ca2+-flux experiments in permeabilized cells pretreated with (3 h) or without (0 h) HBSS. Left: Ca2+ content is shown as a function of time of efflux. The single arrow indicates the addition of 10 µM A23187 (triangles); the double arrow represents the amount of Ca2+ released by A23187. Right: Quantification of the Ca2+ released by A23187 (n = 8). (D) Western blot analysis of SERCA2b from lysates of cells pretreated with HBSS for 0, 1, 3 or 5 h. Upper: Representative blots. Lower: Quantitative analysis of protein/GAPDH ratio normalized to control (0 h) conditions (n = 4). (E) Western blot analysis for CaBP proteins: Grp78/BiP (left) and calreticulin. (F) Decrease in ER Ca2+ content as a function of time in permeabilized cells pretreated with (3 h) or without (0 h) HBSS. Traces were normalized and expressed as percentage of the initial Ca2+ content. The ER Ca2+-leak rate is presented as the decline of the ER 45Ca2+-store content as a function of time plotted on a logarithmic scale (n = 4). *p < 0.05; **p < 0.01; ***p < 0.001 (paired t-test).

