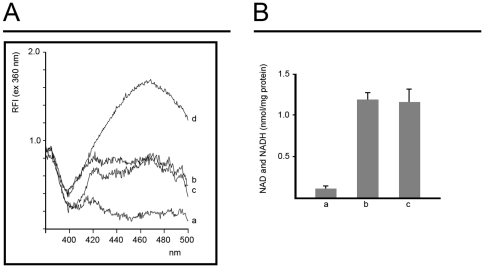
Figure 4. Release of pyridine nucleotides from mitochondria.
Mitochondria were incubated as described in the legend of fig. 2, whereupon they were sedimented by centrifugation. The supernatants were collected for measurement of pyridine nucleotides by fluorescence spectroscopy after enzymatic conversion of NAD+ to NADH. Panel A: emission spectra of mitochondrial supernatants with the excitation wavelength set to 360 nm. Trace a shows control mitochondria. The mitochondrial suspension was supplemented with 50 µM Ca2+ in trace b, 5 µM histone H1.2 in trace c, and 1 µM NAD+ in trace d. Panel B: amounts of pyridine nucleotides released from mitochondria calculated from the fluorescence spectra. The experimental conditions were as in panel A (n = 4, error bars show S.E.M.).

