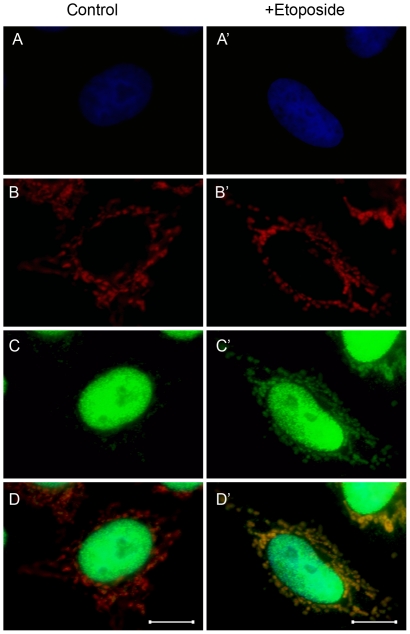
Figure 5. Translocation of histone H3 following DNA damage in mtRFP-HeLa cells.
HeLa cells stably expressing mtRFP were incubated with etoposide and chemically fixed for immunofluorescence microscopy. A and A′: nuclei visualized with bisbenzimide staining (excitation 350 nm, emission 460 nm), B and B′: mitochondria visualized with mtRFP (excitation 553 nm, emission 574 nm), C and C′: anti-histone H3 antibody visualized with anti rabbit IgG Alexa 488 conjugate (excitation 485 nm, emission 531 nm), D: overlay of images B and C, and D′: overlay of images B′ and C′. The scale bar is 5 µM.

