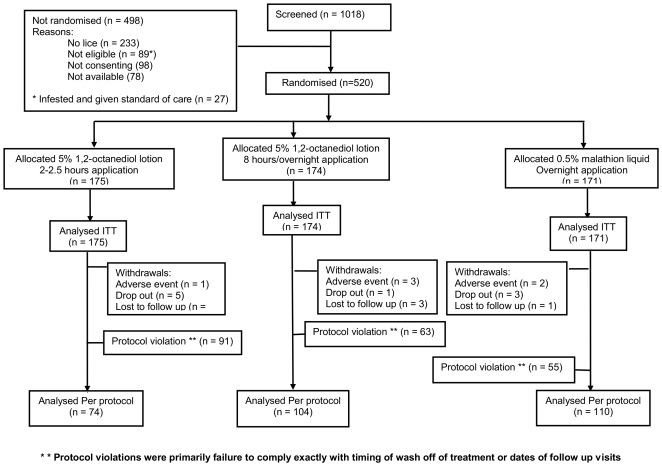
Figure 3. Flowchart of participants through Study 2.
CONSORT flowchart of participants through Study 2. There was a large difference in numbers analysed by intention to treat (ITT) and per-protocol (PP) mainly due to a specific set of protocol violations indicated by (**). These protocol violations were primarily failure to comply exactly with timing of wash off of treatment or dates of follow up visits.

