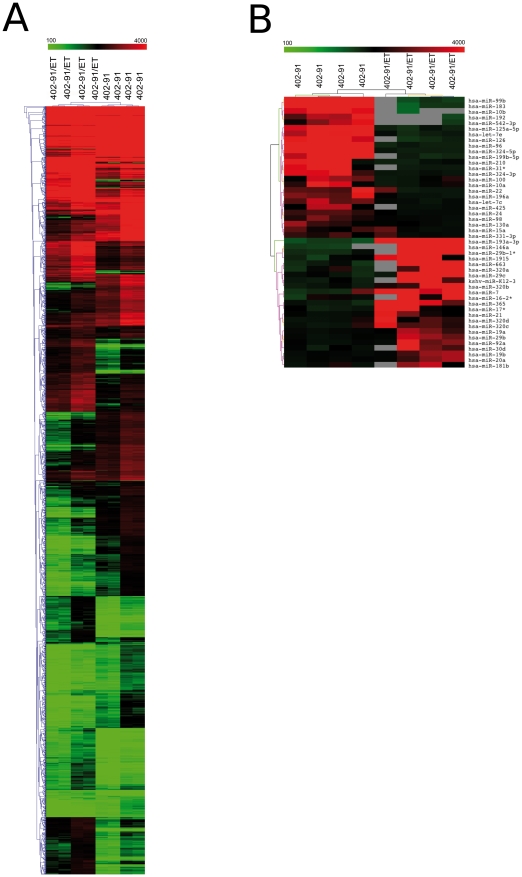
Figure 1. Heat maps of genes and miRNAs differentially expressed between 402-91/ET and 402-91 cells.
Panel A. Heat map and cluster analysis of the 3,083 differentially expressed probes between resistant and sensitive cell lines. Red and green represent respectively differentially upregulated and downregulated genes in 402-91/ET cell lines. Panel B. Heat map and cluster analysis of the 48 miRNA differentially expressed between resistant and sensitive cell lines. Red and green represent respectively differentially upregulated and downregulated genes in 402-91/ET cell lines. Gray is for missing values.

