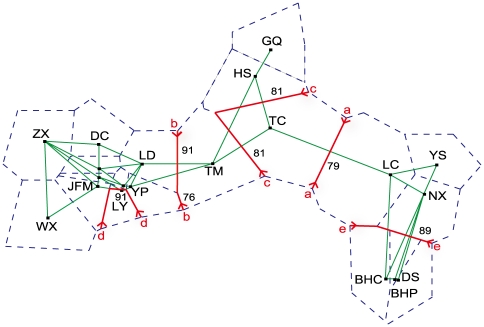
Figure 3. The first five genetic boundaries (thick lines) detected by BARRIER version 2.2 using genetic distance.
The order of the alphabetical pairs represents the sequence of the boundary formation. Large numbers correspond to the population numbers plotted along the ordination. Small numbers represent the bootstrap values indicating support for the respective boundaries. Thin dashed lines and solid lines represent the Voronoi tessellation and the Delaunay triangulation, respectively.

