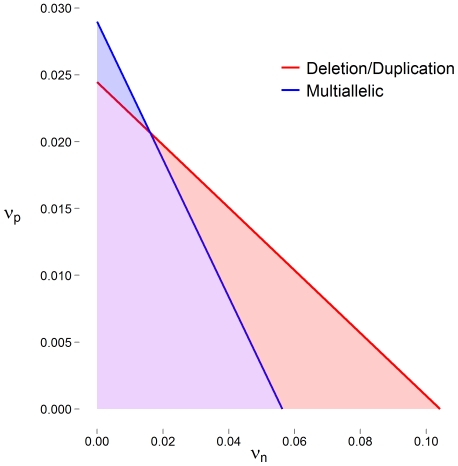
Figure 1. False positive (νp) and false negative rates (νn) for which the standard deviation of Δ is equal to 0.15 are represented as solid lines for a deletion-only or duplication-only CNV locus (red) or multiallelic locus, including both deletions and duplications (blue).
Shaded areas represent sets of rates when the variance of Δ is less than the variance typically observed in LRR measurements. In these situations CNV calling algorithms are reducing measurement noise.

