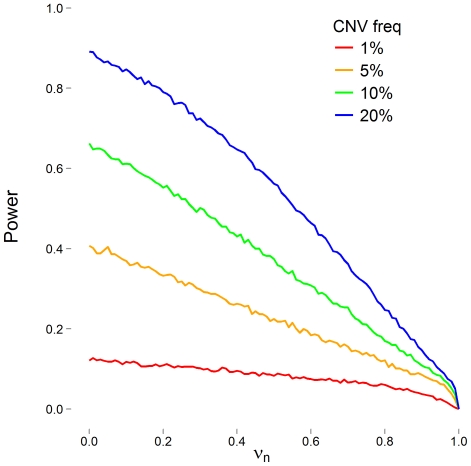
Figure 2. Simulated statistical power to detect an association with a putative CNV as a function of false negative rate (νn).
The CNV explains 1% of the phenotypic variation when present in 20% of the population. The CNV has a frequency of 1% (red), 5% (orange), 10% (green), or 20% (blue). False positive rate (νp) is zero.

