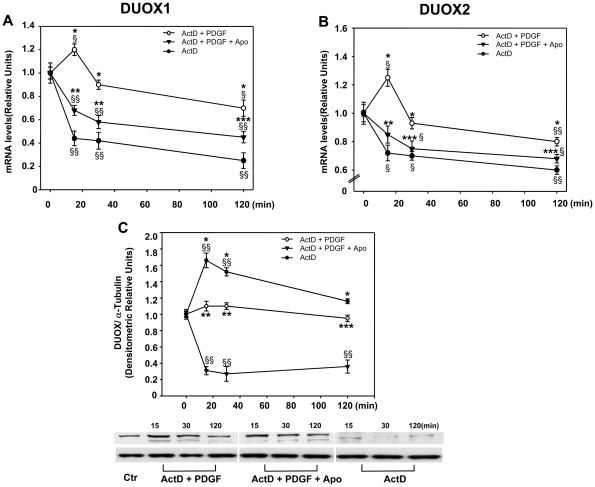
Figure 5. PDGF increases DUOX1 and 2 mRNAs stability.
(A, B) RT- PCR analysis of DUOX 1 and 2 mRNA levels of SK-N-BE cells incubated 18h in medium containing 0.2% FBS, and then treated with of 1µg/ml of actinomycin D for the indicated times in absence or presence of 15ng/ml of PDGF and 50µM apocynin as indicated. Values are mean +/- SEM relative to control of three independent experiments. (B) Western blotting analysis of DUOX protein levels of SK-N-BE cells treated as in (A). Values are mean +/- SEM relative to control obtained by densitometric analysis of DUOX bands normalized for α-tubulin of three independent experiments. § p<0.05 and §§ p<0.01 vs Ctr; * p<0.01 vs the corresponding time point of ActD curve; ** p<0.01 and *** p<0.05 vs the corresponding time point of ActD + PDGF curve.

