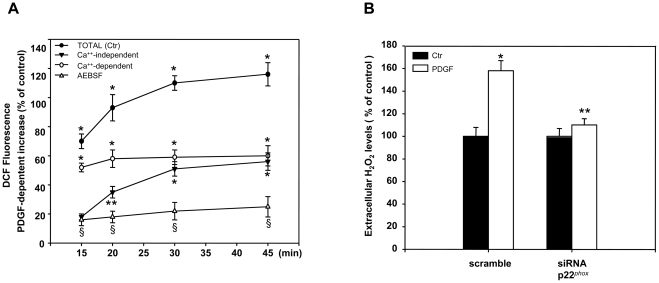
Figure 6. ROS levels in PDGF stimulated SK-N-BE cells.
(A) Cells were incubated 18h in medium containing 0.2% FBS, loaded with 10µM DCHF-DA in the presence or absence of the intracellular calcium chelator, BAPTA-AM (10µM), and then stimulated with 15ng/ml of PDGF as described in Materials and Methods. ROS levels were measured fluorimetrically at the time intervals indicated. Ca++-independent ROS were measured in presence of BAPTA-AM. Ca++-dependent ROS levels were derived from the assays performed in the presence or absence of BAPTA-AM. Total levels of ROS induced by PDGF were also measured in the absence (Total) or presence of the NADPH oxidase inhibitor AEBSF. Values are Mean +/- SEM of three independent experiments performed in triplicate. * p< 0.01 and ** p< 0.05 vs not stimulated; § p<0.01 vs the corresponding time point of Total (Ctr) curve. (B) Cells were transfected by electroporation with siRNA to p22phox (siRNA p22phox) or control, scrambled siRNA (scramble) as described in Materials and Methods. 24h after transfection cells were incubated in medium containing 0.2%FBS for 18h and then stimulated with 15ng/ml of PDGF for 15min. An aliquot of cell medium was collected and analyzed for H2O2 levels as described in Materials and Methods. The histograms show the mean +/- SEM values of three independent experiments. * p< 0.01 vs Ctr. ** p< 0.01 vs PDGF stimulated scramble.

