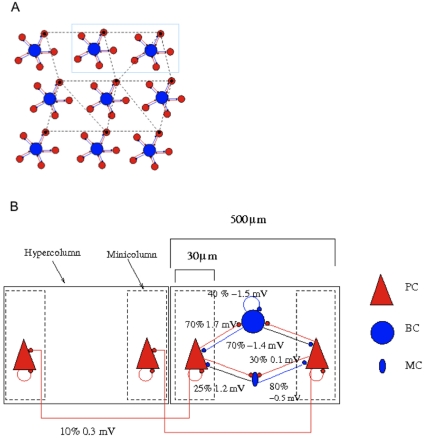
Figure 2. Schematic of the network arrangement and all the excitatory and inhibitory pathways between different cell types and their connection densities in the model.
(A) Cartoon of a network of 9 hypercolumns with 5 minicolumns each. The model used had 36 hypercolumns. Each hypercolumn has 5 circularly arranged minicolumns. A minicolumn, represented by red discs, contains 30 densely connected (25%) PCs denoting local re-entry. The minicolumns in a hypercolumn receive inhibition from the cell population represented by blue discs, the excitatory (red) and inhibitory synapses (blue) are also shown. Dashed lines show minicolumns that are connected and distributed in different hypercolumns, which forms a pattern. (B) A small segment of the network blown-up to show the particulars, only here we see each blue disc houses 2 inhibitory cell types.

