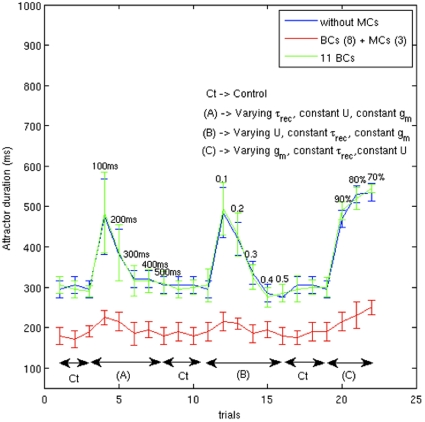
Figure 6. Each hypercolumn contains 8 BC and 3 MC.
Here we investigated the sensitivity of the network during different conditions, similar to the ones in Fig. 5, when each hypercolumn has a) 8 BC b) 8 BC + 3 MC and c) 8 BC + 3 BC in total 11 BC. Again, we have used the “40/80” paradigm for the connections between PCs and MCs like in Fig. 5. The response of the network to 8 BC (blue) and 8BC + 3 MC (red) are taken from Fig. 5 (see the blue and red curve there). Conflating the BCs and MCs population, 11 BC, in all hypercolumns doesn’t make the network insensitive to changes in synaptic and cell parameters (green). We observe strong peaks during the lower values of short-term depression and adaptation.

