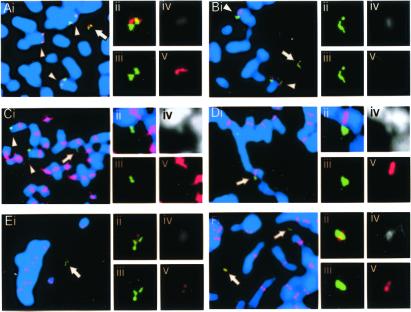
Figure 4.
FISH and/or immunofluorescence analysis on NC-MiC5. Green and red denote E8 FISH signal and test probe signal, respectively. (A) FISH using B48L24, positive on NC-MiC5. (B) FISH using B69K10, negative on NC-MiC5. (C) FISH using pTRA7, showing absence of α-satellite sequences on NC-MiC5. (D) Immunofluorescence using anti-CENP-B antibody, negative on NC-MiC5. (E) Immunofluorescence using anti-CENP-C antibody, positive on NC-MiC5. (F) Immunofluorescence using anti-CENP-E antibody, positive on NC-MiC5. (ii–v) Combined image, and split images for green, DAPI, and red, for the NC-MiCs.

