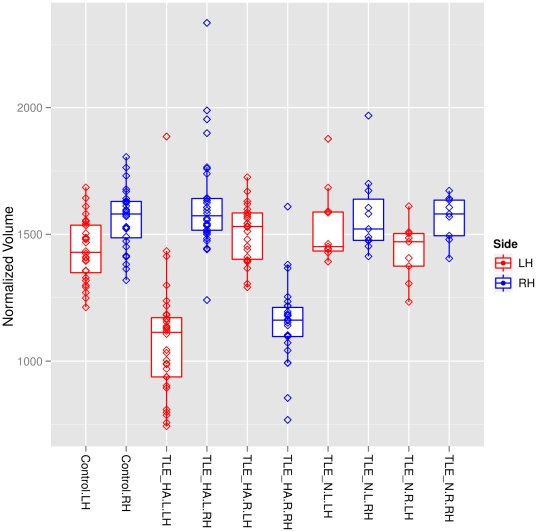
Figure 4. Hippocampal volumes in patients and controls.
Horizontal lines show the medians, boxes indicate interquartile ranges, whiskers show the minimal and maximal values inside the main data, and lozenges show individual values. Blue, right hippocampi; red, left hippocampi. TLE-HA, TLE with hippocampal atrophy; TLE-N; TLE with normal MRI on visual inspection. Suffixes _L and _R denote left and right sided seizure focus, respectively.

