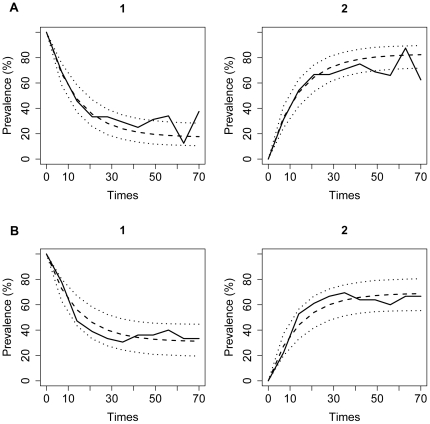
Figure 4. Observed versus expected prevalence of pigs in the states of the immune response model.
Shown are prevalences for the models using the custom cut-offs (panel A) and manufacturer based cut-offs (for all serotypes except S. Yoruba; panel B). The states are labeled 1 and 2, denoting an immune response below and above the seroconversion level, respectively. Full line indicates the observed, while dashed and dotted lines denote mean and 95% CI of the expected prevalence.

