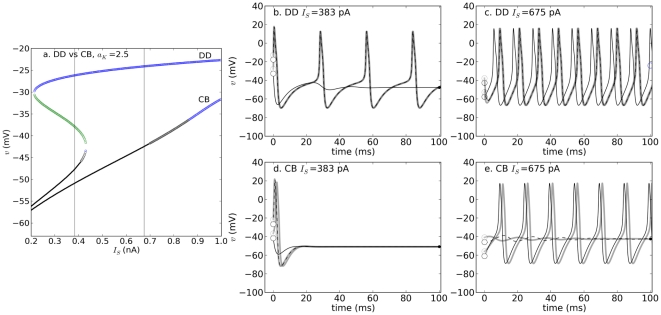
Figure 3. Bifurcation structure and dynamics of DD and CB models for  . a.
. a.
Bifurcation profiles. b–e. Dynamics of the DD (b,c) and CB model (d,e) for different initial conditions, for two values of  (vertical lines gray lines in a). The initial conditions are shown as empty dots near the left axis and the fixed points are shown on the right portion of each diagram.

