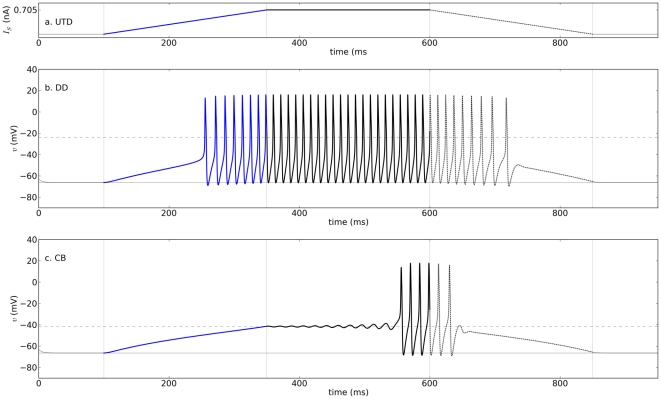
Figure 4. Dynamics of the model with DD currents and UTD stimulation.
Panels a–c show, respectively, the current stimulus, membrane potentials of DD, and CB models as a function of time. Epochs last 250 milliseconds each (slope  2.82 nA/ms),
  , maximum stimulus amplitude 705 pA, and all other parameters as in Table 2.

