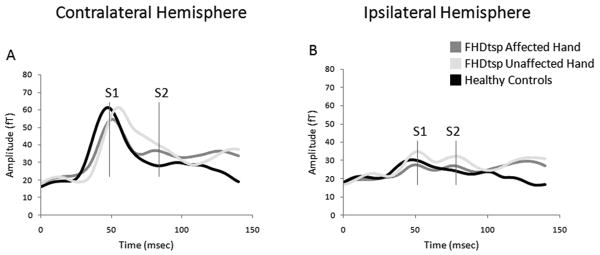
Figure 3.
Average amplitude (RMS) over time: Oddball condition. Average of the peak sensor amplitude (RMS: root mean square) from the time of the somatosensory stimulus at 0 msecs to 150 msecs after the stimulus for the ipsilateral (A) and contralateral (B) hemispheres. (B) is represented for the affected hands of subjects with tspFHD, the unaffected hands of subjects with tspFHD, and the right and left hands of healthy volunteers. The approximate early (S1) and late (S2/PV) peaks are marked (in red lines). Similar waveforms occur for both the low rate and high rate conditions.

