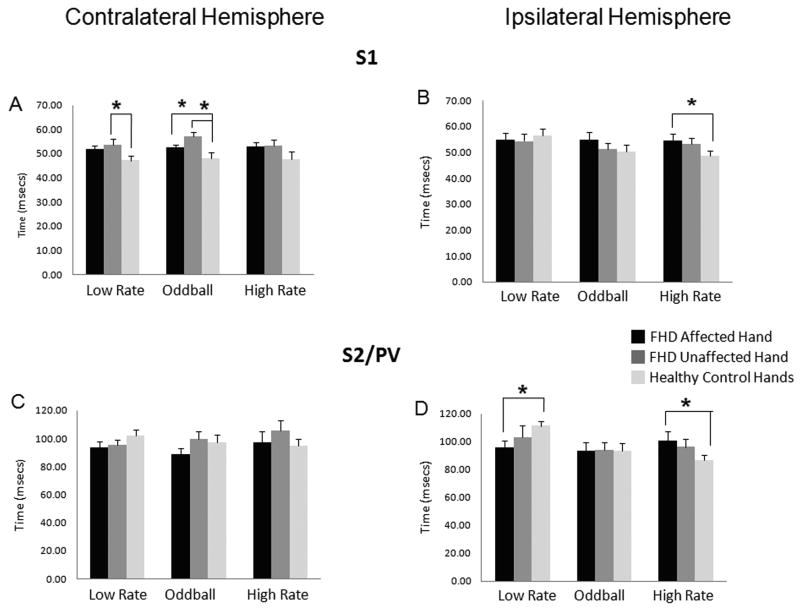
Figure 5.
Latency of S1 and S2/PV responses. Average latency at the peak sensor amplitude (RMS) for the ipsilateral and contralateral early S1 (30-70msecs) and late S2/PV (70-130 msecs) responses under three experimental conditions is compared between the affected hands of subjects with tspFHD, the unaffected hands of subjects with tspFHD, and the right and left hands of healthy volunteers. The three experimental conditions include the deviant stimuli at low rate (condition 1 in Figure 1, mean ISI: 2 secs), the deviant plus the standard stimuli or oddball condition (condition 3 in Figure 1, mean ISI: 0.33 secs), the deviant at high rate (condition 2 in Figure 1, mean ISI: 0.33 secs). Asterisks indicate the responses that are significantly different (p<0.05) from others that are connected by lines. A) Average latency in contralateral S1 to the hand stimulated. B) Average latency in ipsilateral S1 to the hand stimulated. C) Average latency in contralateral S2/PV to the hand stimulated. D) Average latency in ipsilateral S2/PV to the hand stimulated.

